
Case Study:
2200 Seat Theatre
Part 1
Me: “So, exactly what is
the problem?”
TD: “Well, I’ve been told the array’s aren’t the same, well, I don’t ever mix anything in here- it’s just what I’m told by the guest engineers…”
Being called into a local theatre is a rarity for me these days since I mostly spend my time working on sound systems for rock clubs. It’s not that I have no interest in the theatre, in fact, it’s my first love. Long before the rock-n-roll bug, I was completely immersed musical theatre. To this day it’s become a great break from the countless venues where it’s considered acceptable to sing along to what’s happening on the stage while consuming your favorite cocktail.
So, as I was packing my workbox of analysis equipment, packing blankets and PowerBook, my mind started to speculate on all the scenarios that could make a room sound funny. As we do this type of work more and more it becomes more clearly that there seems to be hundreds of possibilities. The technical director of the building was quite busy and wasn’t available on such short notice for a pre-op interview, instead he led me to the theatre’s main website where I downloaded one of the most complete technical packages I’d ever seen. The package included all of the basics and included cross sections of the facility with distances and angles only available with the use of laser tools.
Based on the tech package it was very clear that great care had been taken to hang the current LCR system and any of the common short cuts were omitted. After ruling out hanging errors I began to study the equipment list for the building and doing the basic task of being sure that the amplification matched the requirements of the system manufacturer. Most of it looked good, but I did notice that the high frequency drivers were a little underpowered, nothing new, right?
The following morning the theatre technical director greeted me. Then in turn, introduced me to the Sound Dept Head for the Auditorium. I got a chance to ask all the questions that I felt were needed to begin the day, but the TD already had a good idea of what he wanted me to do and began to read me his laundry list of small tasks. The common denominator of the list was "that he wanted full documentation where ever possible." Since the TD was an accomplished systems engineer himself, I felt confident I knew where I should concentrate my time and energy.
As a continuance of the thorough technical package that I had already seen, he told me to start with the amp racks. He wanted to confirm all DSP settings were identical in the left and right house processors and that each amplifier was behaving identically as its stereo counter-part. Working with the sound head we were to document as much as I could along the way and make special notice of any inconsistencies that might be present. After a thorough inspection of the DSP and Amplification I was then to set-up the measurement system in the house and begin task of documenting the pass-bands as they exited the DSP. I was eager to get to the part where we measure acoustics, but there was much to do in the amp racks without turning the system on. I moved at the speed of the sound head (not the speed of sound) since he knew the ins and outs of the entire system.
As my guide and I sat down we started to compare DSP settings, I called out what I saw and he confirmed he had the same. During this process I inquired how they came up with the settings and I was told that the manufacturer had helped them come up with a scenario based on the available amplification and how the speaker system was going to be set-up. They had no access to blue prints so they had to make a lot of assumptions based on a speaker system that they clearly knew very well. (I wasn’t real shocked at this since they already know that no parametric will fix the acoustic phenomena specific to the venue.) After this step we then excited the amplification with Pink Noise and made use of a volt-ohm meter to confirm that each output was producing the same voltage as its stereo counterpart. So far, so good, we were an hour into the day and I began to wish I had negotiated a flat rate for the day.
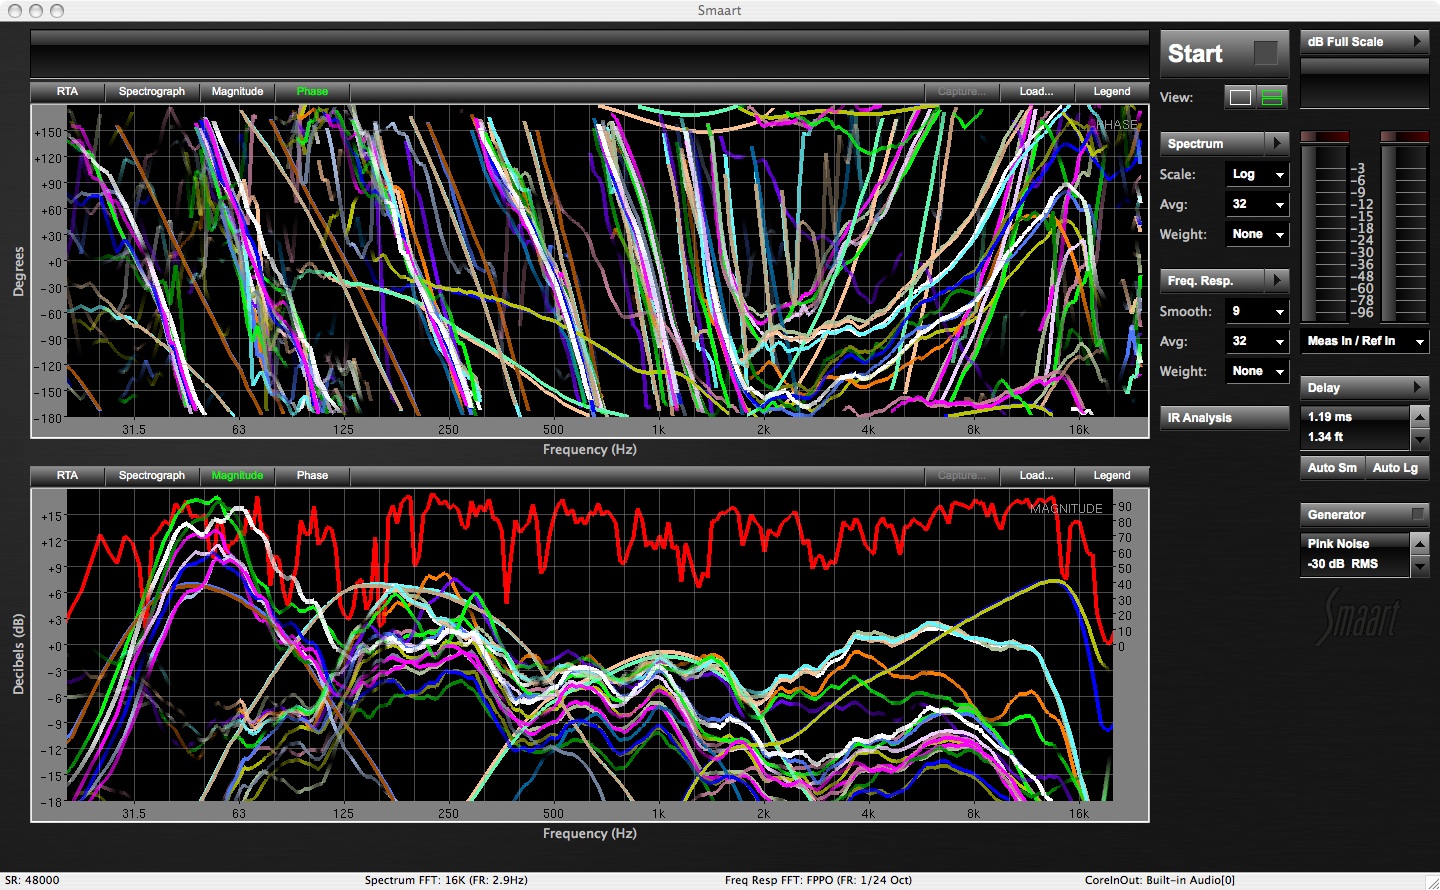
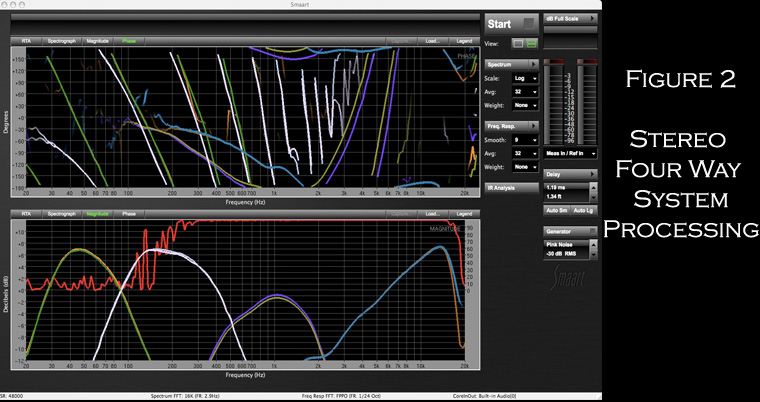
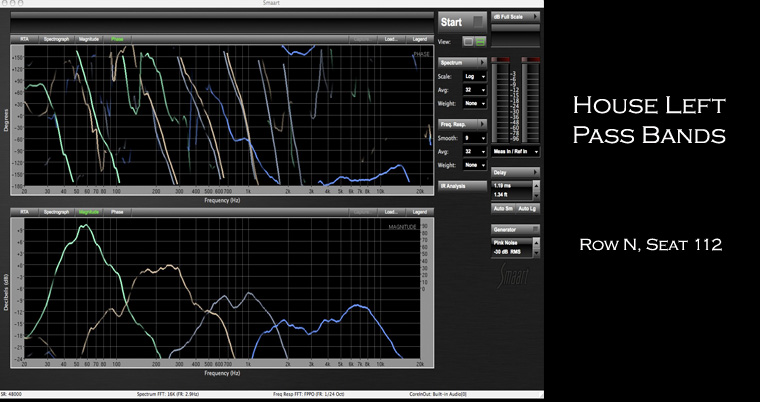
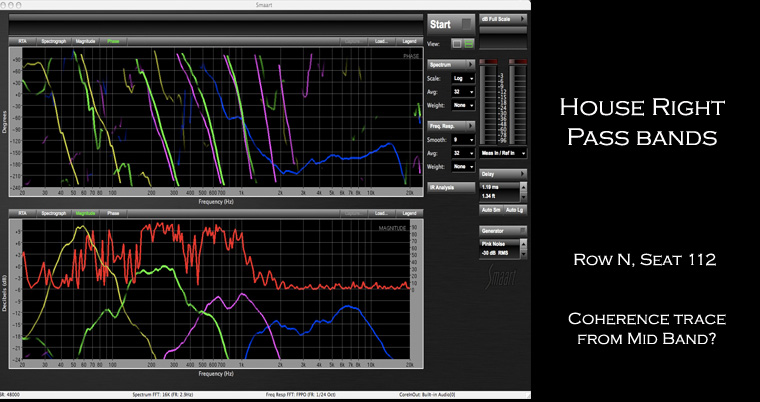
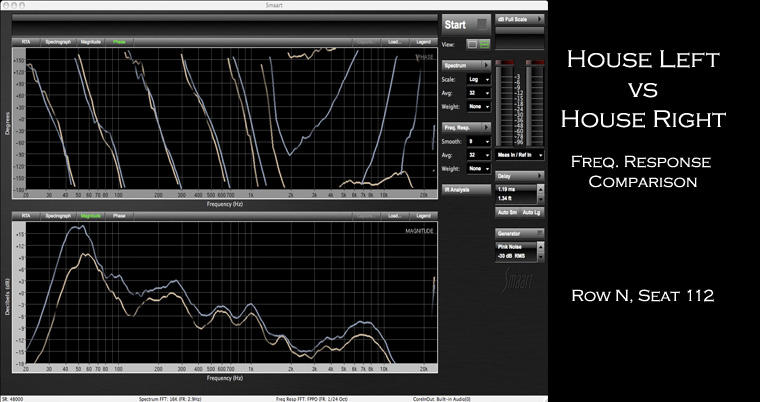
It was then time to get out the PowerBook and employ Rational Acoustics' "Smaart" software and our two brains quickly became three. Since the Left/Right systems were set-up as Stereo Four-Way, each of the processors was essentially set-up as 1x4, which meant there were 8 toal outputs that need to be tested. I began with having my helper replace the input with a new line that I would supply pink noise. Each output was retuned to me and I captured the defined Frequency Response of each pass band and its resulting Phase Response (Fig 2). Each time we collected the data I ran the delay locator in Smaart to double check any delay that was purposely loaded into the processor. I also kept the coherence trace in tact to be sure that we reduced errors in the discovery stage.
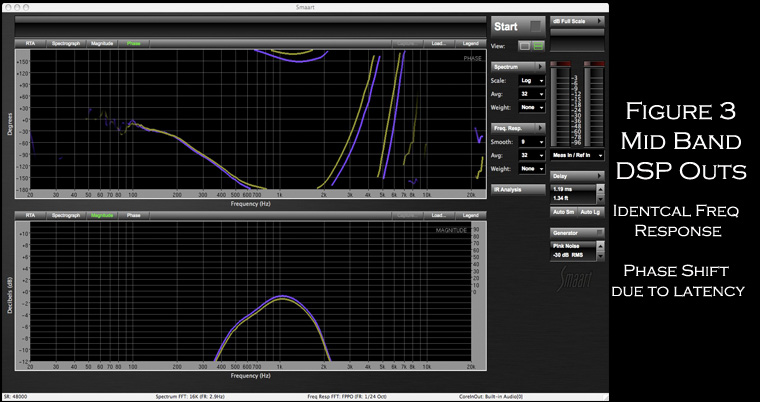
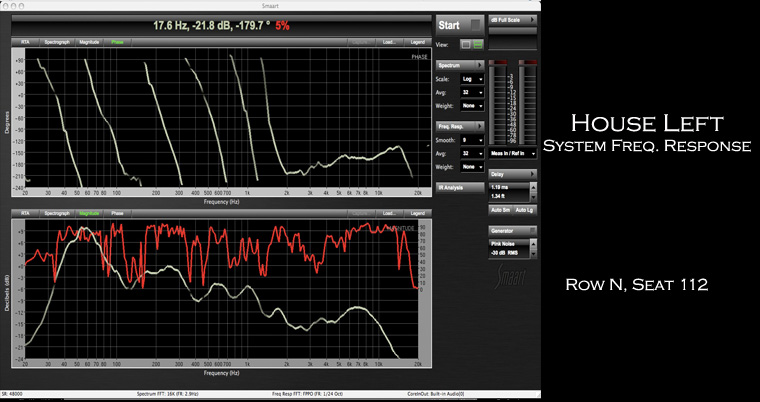
Once we had captured all of the traces from the processor outputs I found a few anomalies between one output and it’s corresponding stereo output. The frequency response from each pass-band seemed to act within a tolerance, but the phase response wasn’t as coherent. The mid range output that covered roughly 500Hz to 2.2kHz seemed to be exhibiting a phase shift that occurs when there is a small latency between them.
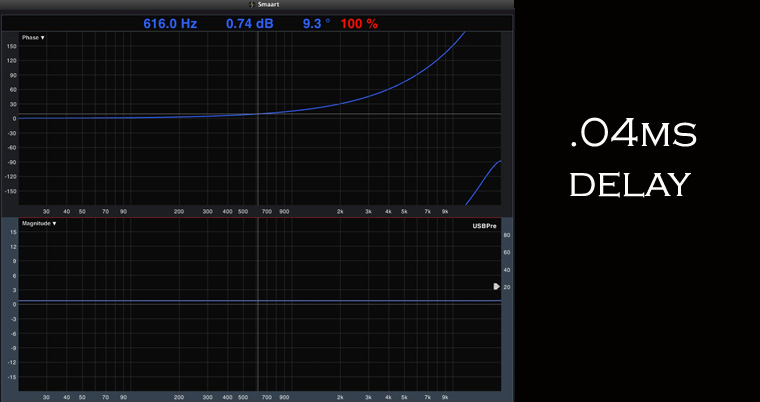
The .04 milliseconds seemed to be enough to cause the mid range phase shift in Figure 3. It’s important to note that this small amount of shift isn’t as harmful to its stereo counterpart, but more so the adjacent pass bands in the same array. One of the goals in completing my analysis of the day was to document the frequency response the entire system, but also make recommendations on achieving a phase coherent system. I made some notes about the latency and moved on to the critical listening stage of the left/right system. I set-up my measurement system in the house to move from the electrical to acoustic domain.
It’s been said that you can’t please 100 percent of the people 100 percent of the time. In the world of sound reinforcement that statement can’t truer. Keeping this mind I studied the technical package to determine the vertical coverage angles of the four elements in the arrays and picked a spot that was in the acoustic center of the entire array and somewhat in an area I like to call Production row. This is an aisle that runs from house left to right that is wide enough to accommodate for mid-house mix positions. If there’s anyone whom I needed to take in consideration for a measurement vantage, it’s the visiting production staff.
I picked the golden seat- Row N, Seat 112 (dead center of the house, equidistant from each array.) This position allowed me to measure the both of the arrays without re-positioning my measurement microphone. I then placed large quilt style blankets within eight to ten feet in all forward directions to absorb any floor/seat bounces that might occur. Finally, I placed thick foam blocks behind the microphone to absorb and rear reflections. It was impossible to cut out all of the comb filtering that was occurring, but you do what you can. This temporary diffusion made for a "great audience"- absorbtive quality, sat still and kept quiet.
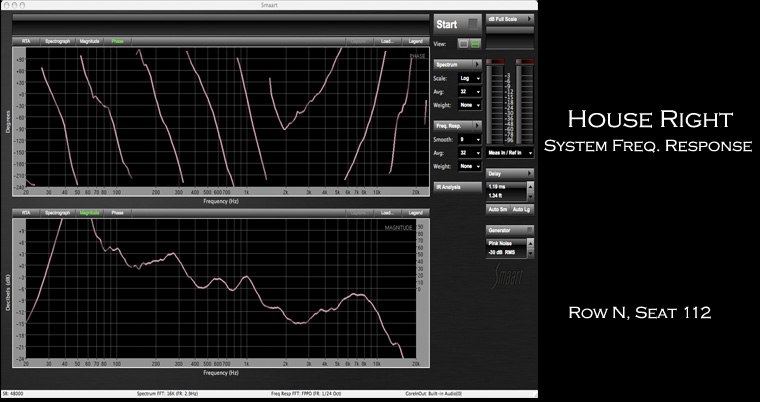
We were a few hours into this analysis and I still hadn’t heard the P.A. or what might be at fault. The time had finally arrived. My system guide sent my pink noise line to the left and right arrays and I took independent SPL measurements. There was roughly a nine-decibel difference between the arrays (Weight: C / Slow Average). The next step was capturing each pass band and an overall transfer function (frequency response) for each array with Smaart. (It should be noted that due to weight constraints the subs were stacked on a dolly and rolled into position on a show by show basis.)
After flipping a coin, drawing straws and Rock-Paper-Scissors we sent the theatre technical director up in the lift to inspect the NL8 cables that jumped all of the boxes. After a clean bill of health it was time to tackle the one hundred foot NL8 run from the Amp Rack to the Sub then another 50 ft from the deck to the flown array. The Technical Director disappeared to do what TD's do, shortly followed by the Dept. Head, I was on my own to repair the cable.
It appeared that all of the connections on the NL8 connector on the amp rack looked good except the pins that were dedicated to the subs. I took it completely apart and reset each of the pins to allow maximum contact between the wire and the cups on the connector. After a visual inspection of the other end we reconnected the system and began to repeat the measurements as before. What we saw at this point is that we had improved our 9dB signal loss (which was mostly subwoofers) to a consistent 2.5 to 3dB loss. We attributed this to general signal loss to the 150 ft of NL8 it takes to get from the amp rack to the House Left Array.
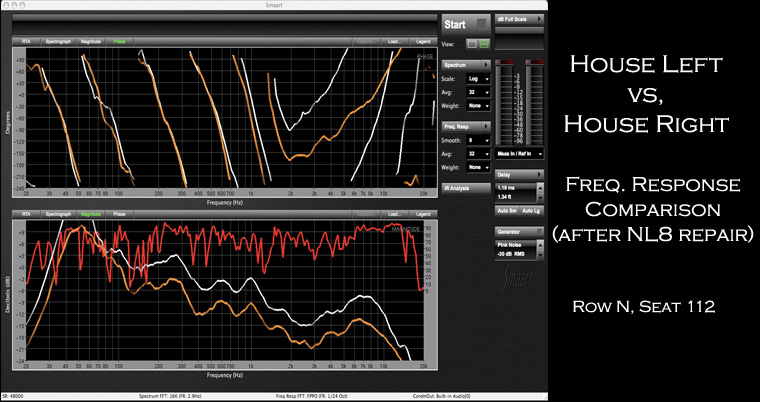
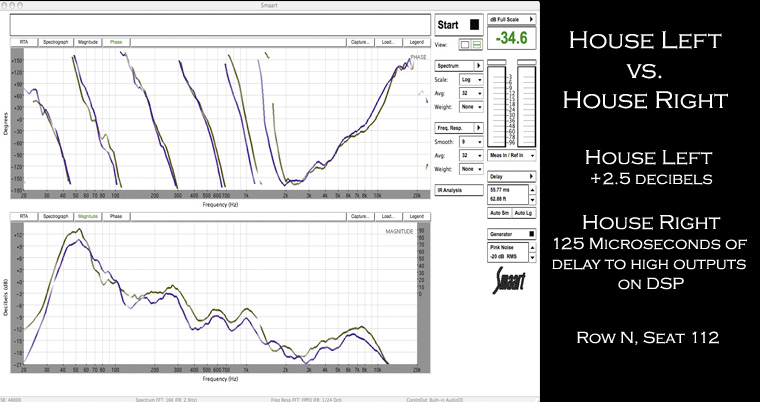
At this point in the game we need to determine what it’s going to take to even the playing field between the left and right arrays. We started by adding 2.5dB to the House Left processor outputs to get the level at all pass bands closer to it’s stereo counterpart. Finally it was time to come back to something that we saw earlier in the process, the phase shift. In figure 8 you may notice that in the phase trace window the White and Orange lines lay on top of each other until they get into high frequency and the House Right (white) begins to run-off and join the circus.
To fix this last issue on our honey do list and ultimately make the Frequency and Phase Response identical we needed to make use of the output delay in the processors. By adding 125 microseconds to the House Right high output we were able to get the results that we set out to get. Since time was getting away from us, I didn't fix the mid band phas shift. I only wanted to show that these types of things can be fixed and the speakers themselves were functioning under the manfacturers specifications.
At this point we were 6 hours in without a meal break, but we decided that were almost there with our data collection. After the sound head agreed to wave the meal penalty, we merely had to reconnect the system drive lines and shut it down. At power down the system processors are designed to revert to the stored program settings. This just meant that there was a slight volume descrephancy in the mirror image and the phase was slightly off. I armed the departmental head with the 2 things that he needed to do the system to correct the areas, but it was up to he and the TD to decide if they wanted to change the processors. After all, at the last stage we were just using the DSP to merely put a band aid on the system.
I headed home to begin putting together screen shots similar to the ones seen here for the TD and let him know our progress. I pin pointed the anomolies in the DSP and the acoustic measurements with emphasis on the cross stage drive cable repair. The next stage in the in the analysis for the theatre will be to dig into the DSP output gain stages, parametric EQ's and delay to give it a flatter frequency response and better phase coherence. Of course these arrays need to play nicely with the mono cluster, which we have yet to hear...